Cyber Attack Data Visualization
Developing a Live Cyber Attack Visualizer
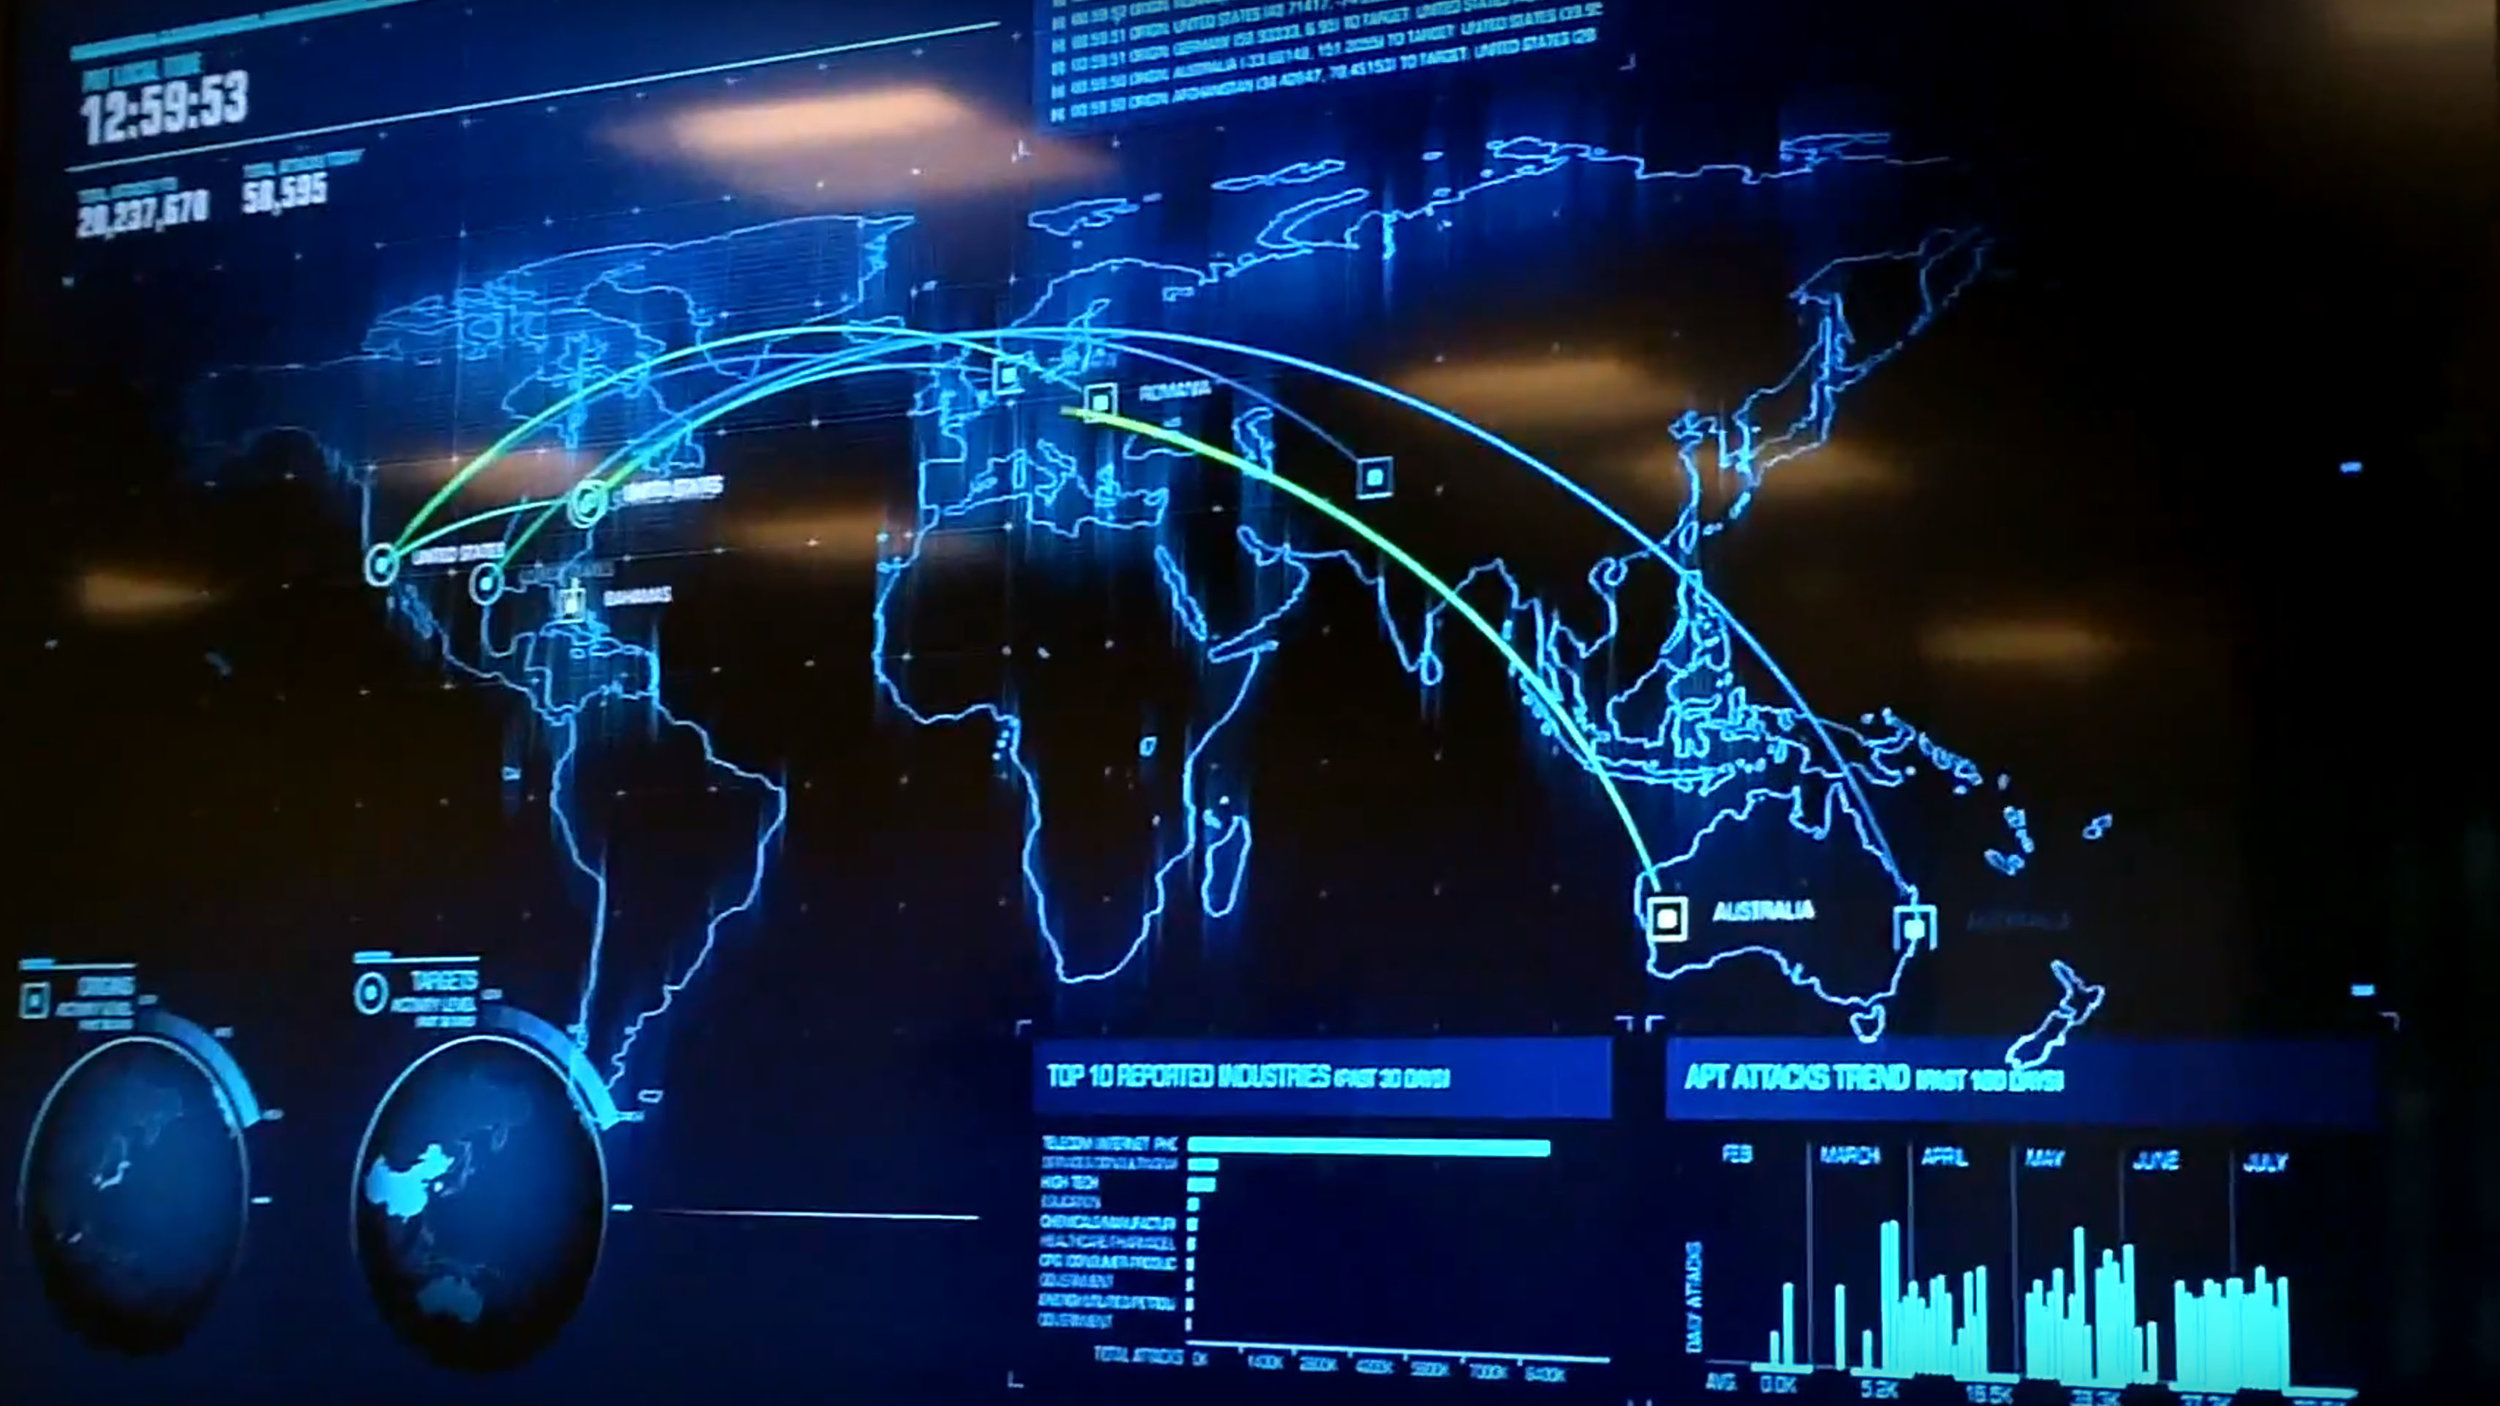
This Threat Map is a commissioned real-time data visualization project. It uses real-time, though somewhat anonymized data. The final piece was installed on a 100” display for a security firm in their corporate lobby.
Roles: Lead Unity developer, software architecture
Collaborators: Duarte (design), Toshi Anders Hoo (production), Anticlockwise Arts
A Cybersecurity Data Visualization Installation
I was a lead coder on this project and worked with the design team to translate their 2D artwork into a real-time display. The project used D3-based graphs and was developed using JavaScript & C#.
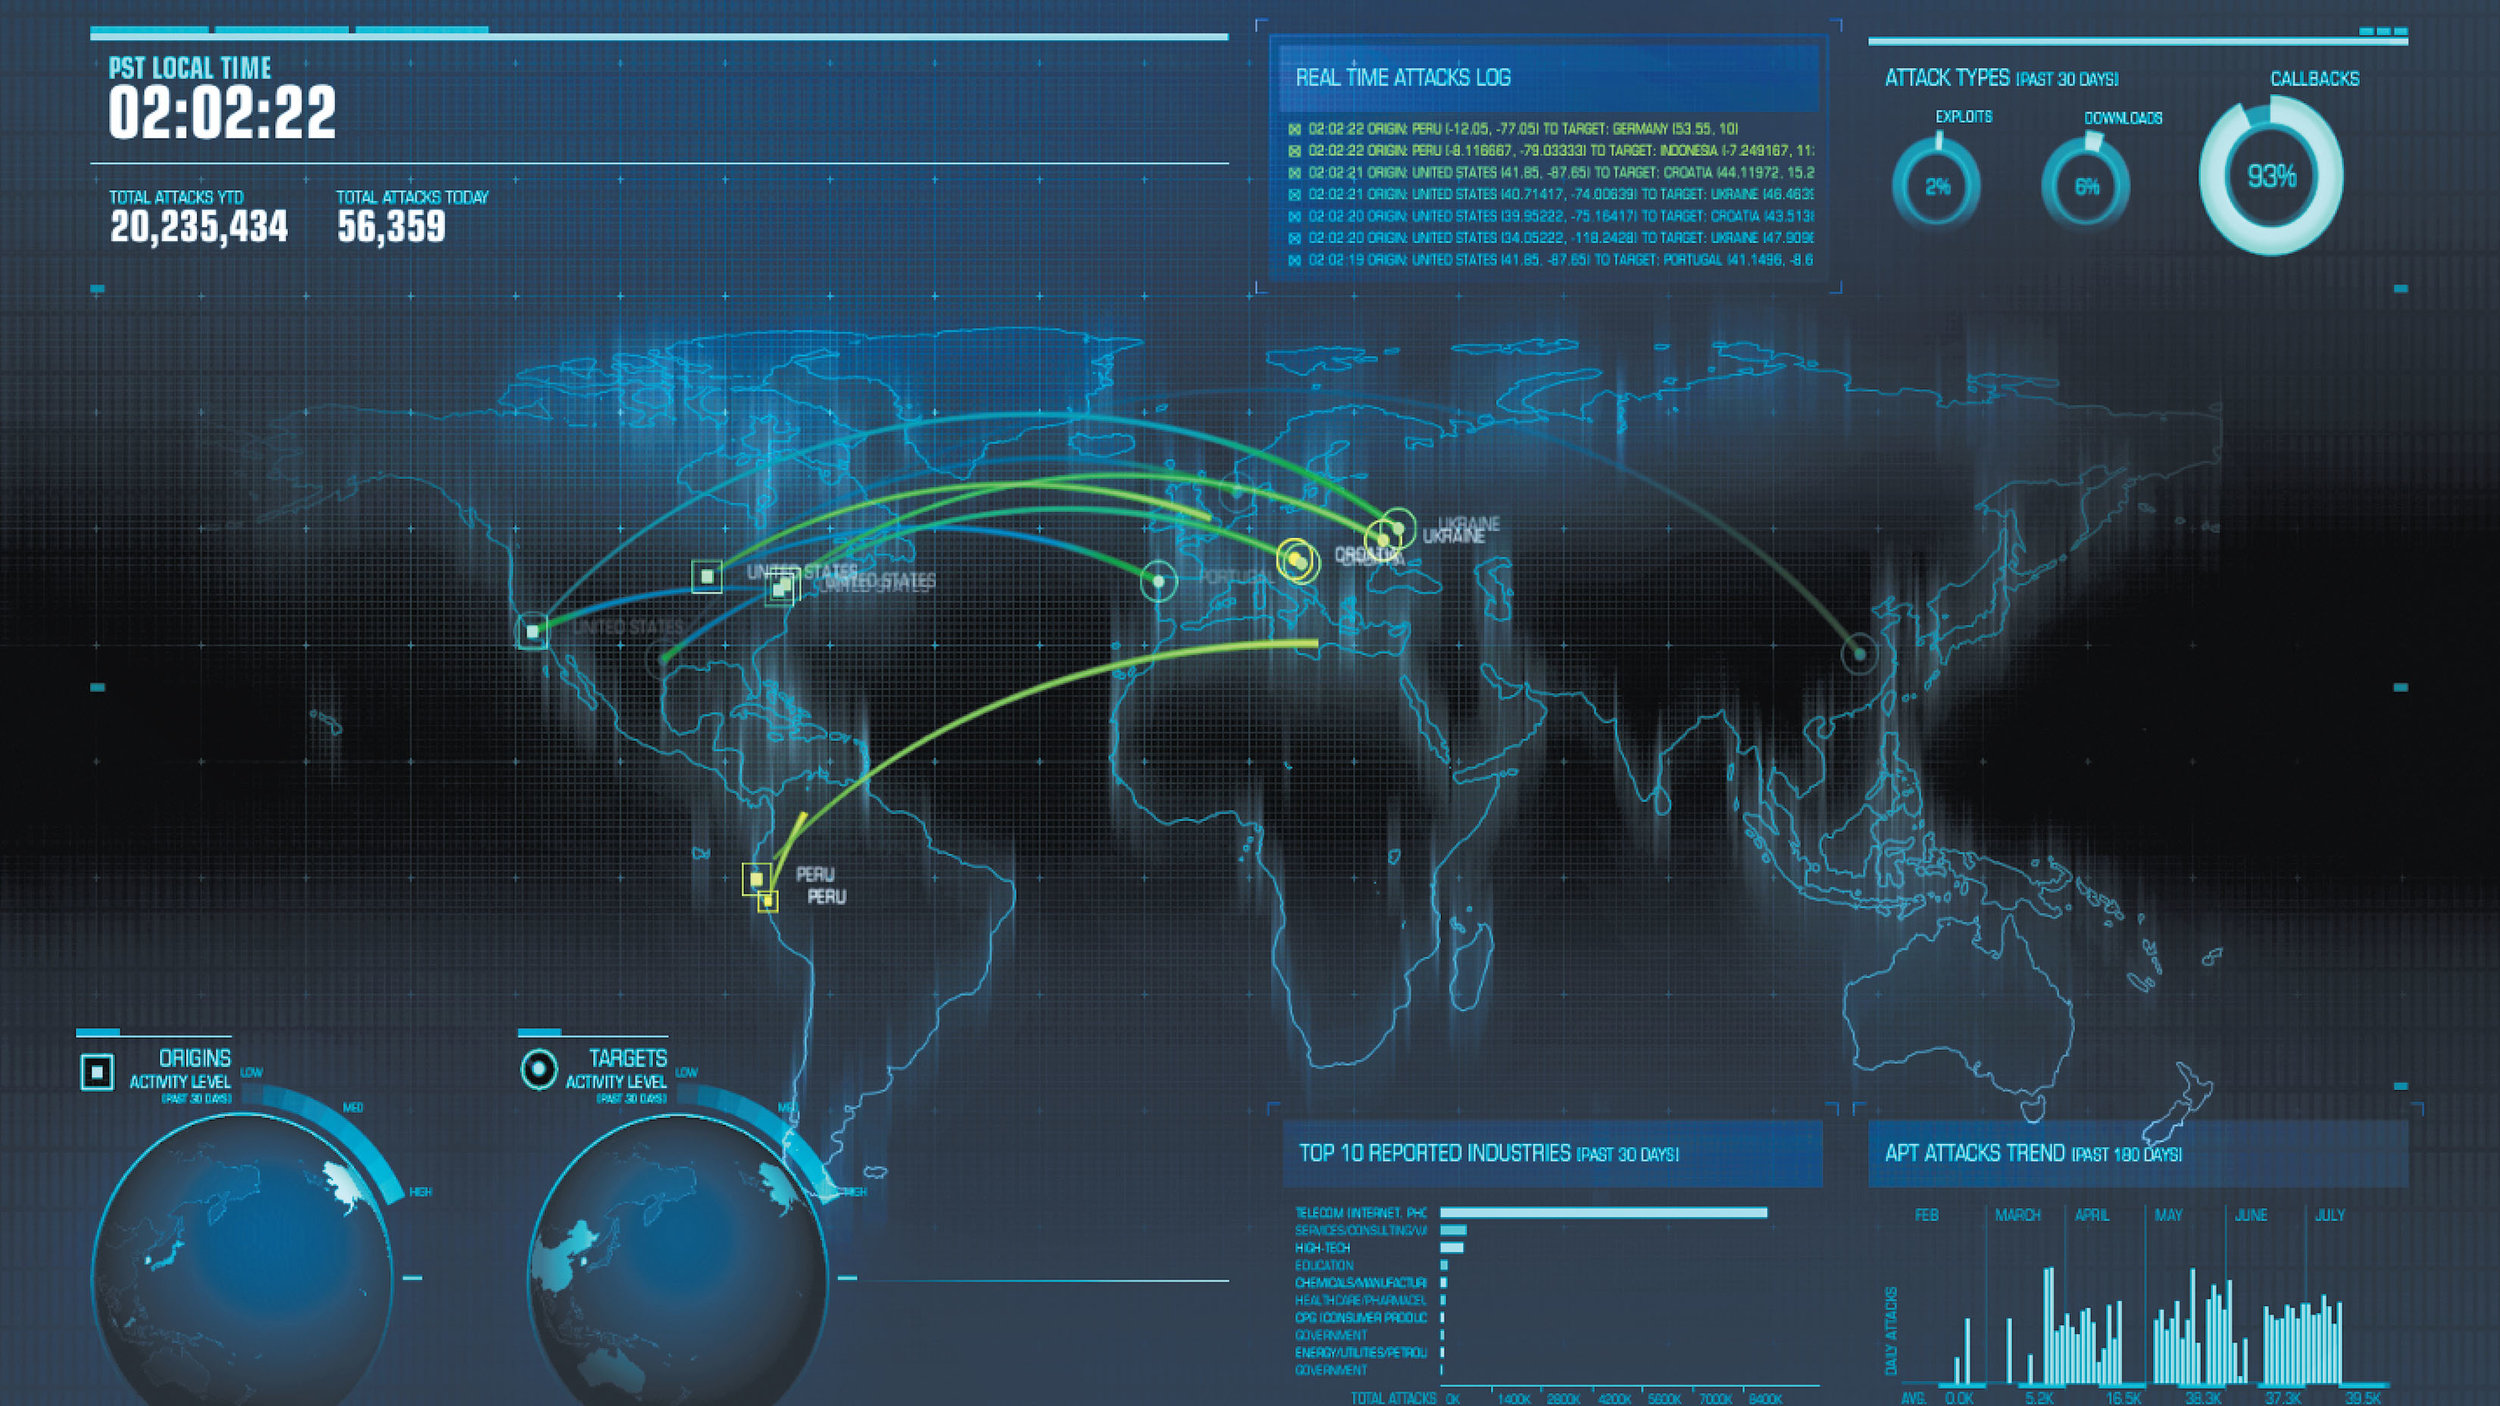
Live Hack Data
We were tasked with translating geocoded hack data into a live map.